
The property management metrics that matter most are occupancy rate, rent collection rate, net operating income (NOI), tenant turnover rate, average days vacant, maintenance response time, operating expense ratio (OER), lease renewal rate, make-ready cost per turn, delinquency rate, revenue growth rate, and average days to lease. According to the KPI framework from Pulse RevOps, these metrics cover both sides of the property management business: tenant revenue protection and owner-facing value creation. Track all twelve, and you have a complete picture of portfolio health.
Here is your immediate checklist:
- Occupancy rate — occupied units ÷ total units
- Rent collection rate — rent collected ÷ rent charged
- Net operating income (NOI) — gross rental income minus operating expenses
- Tenant turnover rate — units turned ÷ total units in a period
- Average days vacant — total vacant days ÷ units vacated
- Maintenance response time — time from request submission to first response
- Operating expense ratio (OER) — total operating expenses ÷ gross operating income
- Lease renewal rate — leases renewed ÷ leases expiring
- Make-ready cost per turn — total turn costs ÷ number of units turned
- Delinquency rate — delinquent rent ÷ total rent charged
- Revenue growth rate — (current period revenue − prior period revenue) ÷ prior period revenue
- Average days to lease — total days to lease ÷ number of units leased
Pull these values for the last 30 days from your rent roll or property dashboard. That single action gives you a baseline to work from.
Key Takeaways
Tracking the right 12 property management KPIs, with clear formulas, assigned owners, and a consistent reporting cadence, is what separates portfolios that grow owner value from those that just collect rent.
| Point | Details |
|---|---|
| Start with 12 core KPIs | Track occupancy, NOI, collection rate, OER, turnover, days vacant, renewal rate, and four more from the BLUF list. |
| Assign owners and cadence | Collections KPIs review weekly; occupancy and NOI monthly; turnover and pricing quarterly. |
| Set targets from your baseline | Use trailing 12-month actuals plus market context, then set a 5%–10% stretch target for the year. |
| Build one consolidated dashboard | Combine rent roll, aged receivables, GL, work-order, and Stripe data in a single portfolio view. |
| QuonSapp accelerates the rollout | Lease tracking, Stripe-native payments, and the portfolio analytics dashboard cover the full 90-day implementation plan. |
Table of Contents
- 2. Why property management KPIs connect daily operations to NOI
- 3. Core financial KPIs that prove owner value
- 4. Leasing and revenue KPIs that determine how much rent you can generate
- 5. How to measure rent collection metrics and reduce arrears
- 6. Operations and maintenance KPIs that protect NOI and reduce turnover
- 7. Tenant and service KPIs that predict renewal behavior
- 8. Portfolio and acquisition KPIs that guide growth decisions
- 9. How to calculate each KPI with two worked examples
- 10. Benchmarks, targets, and reporting cadence for each KPI
- 11. How to build a KPI dashboard and where the data comes from
- 12. What to do when a KPI drifts out of its target range
- 13. Your 90-day KPI implementation plan with QuonSapp
- The KPI habits that actually predict success
- QuonSapp gives you a turnkey KPI foundation from day one
- Useful sources and further reading
2. Why property management KPIs connect daily operations to NOI
KPIs show whether you are protecting rental revenue and growing owner value. Without them, you are managing by feel, and that is where costly surprises come from.
The two-sided KPI framework is the right mental model here. Tenant-facing KPIs (collection rate, satisfaction, renewal rate) protect revenue. Owner-facing KPIs (NOI, OER, capex per unit) measure what that revenue is worth after costs. Both sides must move in the right direction simultaneously.
The relationship between operational and headline KPIs is direct. When average days vacant rises, occupancy falls. When occupancy falls, gross income drops. When gross income drops, NOI contracts, and so does the asset's capitalized value. Maintenance response time, often dismissed as a soft metric, drives tenant satisfaction, which drives renewal rates, which directly reduces turnover costs and vacancy days. Every operational number has a financial consequence.
KPI ownership matters as much as the metrics themselves. VPM Solutions notes that tying each metric to a specific role converts subjective judgment into measurable accountability, making hiring and coaching far more effective. Assign a named owner to each KPI and a review cadence: weekly for collections, monthly for occupancy and NOI, quarterly for turnover and pricing strategy.
Pro Tip: Track every KPI at three levels simultaneously: individual property, portfolio aggregate, and role owner. A property-level fix that improves one building's occupancy by pulling leasing resources from another can harm portfolio performance. The portfolio view catches that trade-off before it costs you.
3. Core financial KPIs that prove owner value
NOI is the headline metric every owner cares about. Everything else in the financial KPI set either feeds into NOI or explains why it moved.
Key financial formulas
Net Operating Income (NOI)
NOI = Gross Rental Income + Other Income − Operating Expenses
Operating expenses include property management fees, maintenance, insurance, taxes, utilities, and landscaping. They exclude mortgage debt service and capital expenditures.
Operating Expense Ratio (OER)
OER = Total Operating Expenses ÷ Gross Operating Income
Revenue Growth Rate
Revenue Growth = (Current Period Revenue − Prior Period Revenue) ÷ Prior Period Revenue
Gross Rent Multiplier (GRM)
GRM = Property Purchase Price ÷ Annual Gross Rent
Make-Ready / Capex Cost Per Unit
Make-Ready Cost Per Unit = Total Turn Costs ÷ Number of Units Turned
Single-property calculation example
| KPI | Formula | Sample Inputs | Result |
|---|---|---|---|
| NOI | Gross Income − Operating Expenses | — | — |
| OER | Operating Expenses ÷ Gross Income | — | 40% |
| Revenue Growth | (Current − Prior) ÷ Prior | — | — |
| Make-Ready Cost | Total Turn Costs ÷ Units Turned | — | — |
OER benchmarks vary by property type. Residential multifamily properties often run in the 35%–50% range; older Class C assets or those with high maintenance loads can push above 50%. Commercial properties with triple-net leases tend to carry lower OERs because tenants absorb more operating costs. Use these as directional targets, not hard rules, and compare against your own historical baseline first. The NARPM Financial Performance Guide provides accounting-aligned definitions that help you align these calculations with owner reporting standards.
Pro Tip: Never include capital improvements in operating expenses when calculating NOI or OER. A roof replacement is a capital expenditure, not an operating cost. Misclassifying it inflates your OER and understates NOI, which can mislead owners about true asset performance.
4. Leasing and revenue KPIs that determine how much rent you can generate
Occupancy and leasing velocity together determine your maximum revenue potential. A property at 95% occupancy with a 14-day average days-to-lease is generating close to its ceiling. One at 88% occupancy with a 45-day average is leaving significant money on the table.
5. How to measure rent collection metrics and reduce arrears
On-time rent collection is the single most direct driver of cash flow. A 2% drop in collection rate on a 50-unit portfolio at $1,500 average rent costs $1,500 per month in lost or delayed revenue, before accounting for the administrative cost of chasing it.
Collection KPI formulas
Rent Collection Rate = Rent Collected ÷ Rent Charged × 100
Delinquency Rate = Delinquent Rent ÷ Total Rent Charged × 100
Average Days to Collect = Sum of Days Past Due for All Delinquent Accounts ÷ Number of Delinquent Accounts
Reading an aging table
An aging table segments outstanding balances by how long they have been overdue: current, 1–30 days, 31–60 days, 61–90 days, and 90+ days. The 90+ band is where collection probability drops sharply and legal action typically becomes necessary. A collections dashboard that displays percent collected, aged receivables by band, and trend lines lets you spot at-risk tenants before they reach the 60-day mark.
Operational actions that recover revenue
Leasey.AI's rent collection research recommends segmenting tenants by payment behavior: consistent on-time payers, occasional late payers, and chronic delinquents. Each segment gets a different intervention. Consistent payers benefit from auto-pay enrollment. Occasional late payers respond well to automated reminders sent three days before and on the due date. Chronic delinquents need a structured escalation path.
Practical escalation thresholds: send a courtesy reminder at day 1 past due, a formal notice at day 5, a late fee assessment at day 10, and a pay-or-quit notice at day 15 (confirm your state's specific notice requirements). Escalate to legal at day 30 if no payment arrangement is in place.
Industry guidance: A balanced KPI scorecard recommends tracking rent collection rate and delinquency rate monthly at minimum, with a weekly collections dashboard for portfolios where cash flow is tight.
6. Operations and maintenance KPIs that protect NOI and reduce turnover
Maintenance responsiveness and cost control reduce turnover and protect NOI. A tenant who waits two weeks for a repair is a tenant who does not renew. A vendor who overbills on routine work quietly erodes your OER.
Core maintenance KPIs and formulas
- First-Time Fix Rate — = Work Orders Resolved on First Visit ÷ Total Work Orders × 100
Spotting degradation in trend charts
Plot average completion time and backlog volume on a monthly trend line. A rising backlog with stable completion time means volume is outpacing capacity. A rising completion time with stable backlog means individual jobs are taking longer, often a vendor performance issue. Both patterns signal different interventions: the first requires staffing or vendor capacity, the second requires SLA renegotiation or vendor replacement.
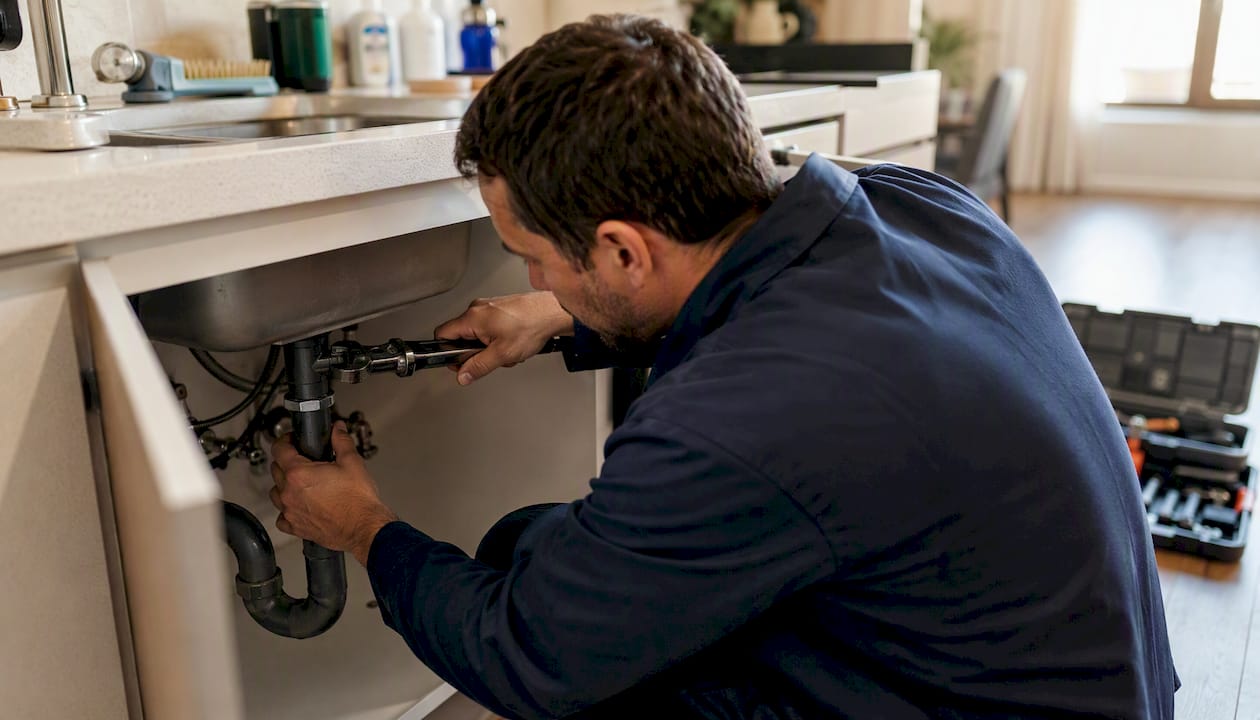
First-time fix rate is the most underused maintenance KPI. A low rate (below 70%) means technicians are returning to the same unit multiple times, which multiplies labor cost and tenant disruption. Tracking it by vendor or staff member quickly identifies who needs coaching or replacement.
Pro Tip: Classify every incoming request as quick-service (under 30 minutes, no parts needed) or scheduled work at intake. Route quick-service items to on-site staff for same-day resolution. This single triage step can cut your average response-time metric by 30%–40% without adding headcount, because the fast jobs no longer sit in the same queue as complex repairs.
7. Tenant and service KPIs that predict renewal behavior
Tenant experience KPIs are leading indicators for renewal behavior, not lagging ones. By the time a tenant gives notice, the satisfaction problem is already months old. Measuring experience continuously gives you time to intervene.
Formulas and survey structure
- Turnover Rate = Units Vacated ÷ Total Units × 100 (annualized: multiply by 12 ÷ months in period)
- Renewal Rate = Leases Renewed ÷ Leases Expiring × 100
- Net Promoter Score (NPS) = % Promoters (score 9–10) − % Detractors (score 0–6) on a 0–10 likelihood-to-recommend question
- Customer Satisfaction Score (CSAT) = Satisfied Responses ÷ Total Responses × 100
Sample survey questions that minimize fatigue while capturing useful data:
- "How satisfied are you with the speed of maintenance responses?" (1–5 scale)
- "How likely are you to renew your lease?" (0–10 scale)
- "Was your most recent issue resolved on the first attempt?" (Yes/No)
- "What is the single thing we could improve?" (open text)
Building Engines research confirms that tenant retention and experience are top performance goals for property managers, and that maintenance responsiveness is the most frequently cited driver of satisfaction scores.
Cost-per-turn worked example
Turnover creates costs through unit preparation and vacancy, so improving renewal rates reduces expenses and income loss from vacancies.
Send satisfaction surveys within 48 hours of a maintenance request being closed. That timing captures the experience while it is fresh and avoids the survey fatigue that comes from end-of-lease questionnaires.
8. Portfolio and acquisition KPIs that guide growth decisions
Portfolio KPIs translate property-level performance into acquisition and retention decisions. Without them, adding a new property feels like a bet rather than a calculated move.
Key acquisition KPIs
Acquisition Cost Per Property = Total Acquisition Costs (legal, due diligence, onboarding) ÷ Number of Properties Acquired
Payback Period = Upfront Acquisition Cost ÷ Annual NOI Uplift from Acquisition
Capex-to-NOI Uplift = Capital Invested in Improvements ÷ Resulting Annual NOI Increase
Properties Won vs. Lost Rate = New Properties Added ÷ (New Properties Added + Properties Lost to Competitors or Non-Renewal)
Acquisition payback example
A payback period under 12 months on acquisition costs is generally a strong signal to proceed. Capex payback beyond three years warrants scrutiny unless the improvement also supports rent growth or reduces turnover risk.
Every acquisition temporarily distorts portfolio aggregates. Occupancy drops during onboarding, collection rate may dip while new tenants enroll in auto-pay, and maintenance backlog spikes as deferred work surfaces. Re-baseline all KPIs 60–90 days post-acquisition to separate the new property's true performance from the integration noise.
9. How to calculate each KPI with two worked examples
Precise formulas plus two worked examples make KPI calculation plug-and-play for any manager. Here is how to run the numbers for a single property and a small portfolio.
10. Benchmarks, targets, and reporting cadence for each KPI
Set targets based on your own baseline plus market context, not on generic industry averages alone. The method: calculate your trailing 12-month average (baseline), compare it to market data from sources like the U.S. Census HVS and local comps, then set a stretch target 5%–10% above baseline for the coming year.
Recommended reporting cadence
| KPI | Cadence | Owner | Green | Yellow | Red |
|---|---|---|---|---|---|
| Rent collection rate | Weekly | Collections manager | ≥97% | 93%–96% | <93% |
| Delinquency rate | Weekly | Collections manager | <3% | 3%–6% | >6% |
| Occupancy rate | Monthly | Leasing manager | ≥93% | 88% | <88% |
| NOI | Monthly | Portfolio manager | At/above budget | 1%–5% below | >5% below |
| OER | Monthly | Portfolio manager | <45% | 45%–55% | >55% |
| Average days to lease | Monthly | Leasing manager | <21 days | — | >35 days |
| Lease renewal rate | Monthly | Leasing manager | at least 80% | 70% to 79% | <70% |
| Maintenance cost/unit | Monthly | Maintenance lead | At/below budget | 5%–15% over | >15% over |
| Avg. completion time | Monthly | Maintenance lead | <48 hours | 48–72 hours | >72 hours |
| Tenant turnover rate | Quarterly | Portfolio manager | under 25% annual | 25% to 35% | >35% |
| Revenue growth rate | Quarterly | Portfolio manager | ≥3% | 1% to under 3% | <1% |
| Make-ready cost/turn | Quarterly | Maintenance lead | At/below budget | 10%–20% over | >20% over |
These thresholds are directional. Class C residential assets will run higher OERs and lower renewal rates than Class A properties in the same market. Segment your benchmarks by property class and submarket to avoid comparing unlike assets.
Reporting checklist for monthly owner reports: NOI vs. budget, occupancy rate, collection rate, delinquency aging summary, top three open maintenance items, and one forward-looking note on lease expirations in the next 60 days.
11. How to build a KPI dashboard and where the data comes from
A single dashboard showing headline portfolio KPIs with property-level drill-down is the monitoring backbone of any well-run portfolio. Without it, you are pulling numbers from three different systems and reconciling them manually every time an owner asks a question.
Dashboard sections and recommended visualizations
Revenue and NOI panel: Monthly trend line for gross income and NOI, with budget variance highlighted. A bar chart comparing NOI by property works well for portfolios of five or more assets.
Collections panel: Percent collected (gauge or large number), aged receivables stacked by band (current, 1–30, 31–60, 61–90, 90+), and a trend line showing collection rate over the trailing 12 months. The RentViewer collections dashboard guide recommends including a delinquent-tenant count alongside the dollar amount so you can distinguish one large delinquency from many small ones.
Leasing panel: Occupancy rate by property, average days to lease (trend), and upcoming lease expirations in a 90-day forward view.
Maintenance panel: Open work-order count, average completion time (trend), backlog by priority level, and first-time fix rate.
Tenant experience panel: NPS or CSAT score (trailing 90 days), renewal rate, and survey response rate.
Canonical data sources
- Pulse RevOps — Industry KPIs for property management
- Leasey.AI — Rent Collection Metrics and Benchmarks for Property Managers
- Balanced Asset Solutions — A Guide to Property Management KPIs
- RentViewer — Real estate collections dashboard guide
- NARPM — Financial Performance Guide Overview
- U.S. Census Bureau — Housing Vacancies and Homeownership (HVS)
- VPM Solutions — Property Management KPIs: Stop managing by feel and start scaling
- QuonSapp — All-in-one property portfolio manager
Pro Tip: Reconcile your Stripe settlement data against the general ledger at least weekly. Payment processor timing differences (settlement delays, partial payments, chargebacks) can make your collection rate look higher than it actually is if you rely on invoice-status alone. A weekly reconciliation catches discrepancies before they compound into a monthly reporting error.
12. What to do when a KPI drifts out of its target range
Use a repeatable triage flow: confirm the data, segment the problem, fix it operationally, then report and prevent. Reacting to a bad number before confirming it is real wastes time and creates owner anxiety unnecessarily.
13. Your 90-day KPI implementation plan with QuonSapp
A focused 90-day plan gives you a functioning KPI scorecard and measurable early wins. The key is sequencing: data first, then reporting, then automation.
Week-by-week implementation tasks
| Phase | Weeks | Tasks | Owner | QuonSapp Feature |
|---|---|---|---|---|
| Data discovery | 1–2 | Import rent roll, map GL categories, pull aged receivables baseline, document unit inventory | Portfolio manager | Bulk CSV import, resident profiles, accounting overview |
| Dashboard build | 3–6 | Configure KPI dashboard, build owner reporting template, set color thresholds, assign KPI owners | Portfolio manager + leasing lead | Portfolio dashboard, payment analytics, lease tracking |
| Automation | 7–10 | Enable automated payment reminders, set up overdue alerts, configure work-order triage rules | Collections + maintenance lead | Overdue alerts, work-order pipeline, push notifications |
| Review and optimize | 11–12 | Run first full monthly KPI review, present owner report, adjust targets based on 60-day actuals | All owners | Analytics dashboard, document generator |
Implementation checklist
- Confirm all units are in the system with correct rent amounts and lease dates.
- Map every GL expense category to an operating or capital classification.
- Set baseline values for all 12 KPIs from the prior 30 days.
- Assign a named owner and review cadence to each KPI.
- Configure automated payment reminders (3 days before due, on due date, day 1 past due).
- Enable Stripe-native online payments so collection data flows directly into your dashboard without manual reconciliation.
- Build the owner report template with NOI, occupancy, collection rate, and delinquency aging.
- Schedule the first monthly KPI review meeting with all role owners.
QuonSapp supports each of these steps directly. Lease tracking with renewal alerts handles the leasing KPI data layer. Stripe-native payments feed collection rate and on-time payment analytics in real time. The maintenance work-order pipeline with photo documentation tracks completion time and first-time fix rate. The portfolio dashboard surfaces occupancy, labor costs, and dues collection at a glance across all properties. For a detailed walkthrough of the automation steps, the 90-day property management automation plan covers the sequencing in depth.
Pro Tip: In weeks 1–2, resist the urge to fix problems you discover during data import. Document them, note the baseline impact, and fix them in week 3 onward. Changing data mid-baseline corrupts your starting point and makes it impossible to measure improvement accurately.
The KPI habits that actually predict success
Most property managers who struggle with KPI programs make the same early mistake: they track too many metrics. A 30-KPI dashboard looks thorough. It is actually paralyzing. When everything is measured, nothing gets acted on, and the program quietly dies after the first quarter.
The organizational habit that predicts success is simpler than most people expect: assign one person's name to each KPI. Not a team. Not a department. One person who owns the number, explains it in the monthly review, and is responsible for the corrective action when it drifts. That single structural choice converts a reporting exercise into an accountability system.
The other common pitfall is inconsistent definitions. If your leasing manager calculates renewal rate as leases renewed ÷ leases expiring, but your accounting system counts it differently, you will spend every review meeting arguing about the number instead of acting on it. Standardize definitions in writing before you start tracking, and document them in a KPI glossary that every role owner signs off on.
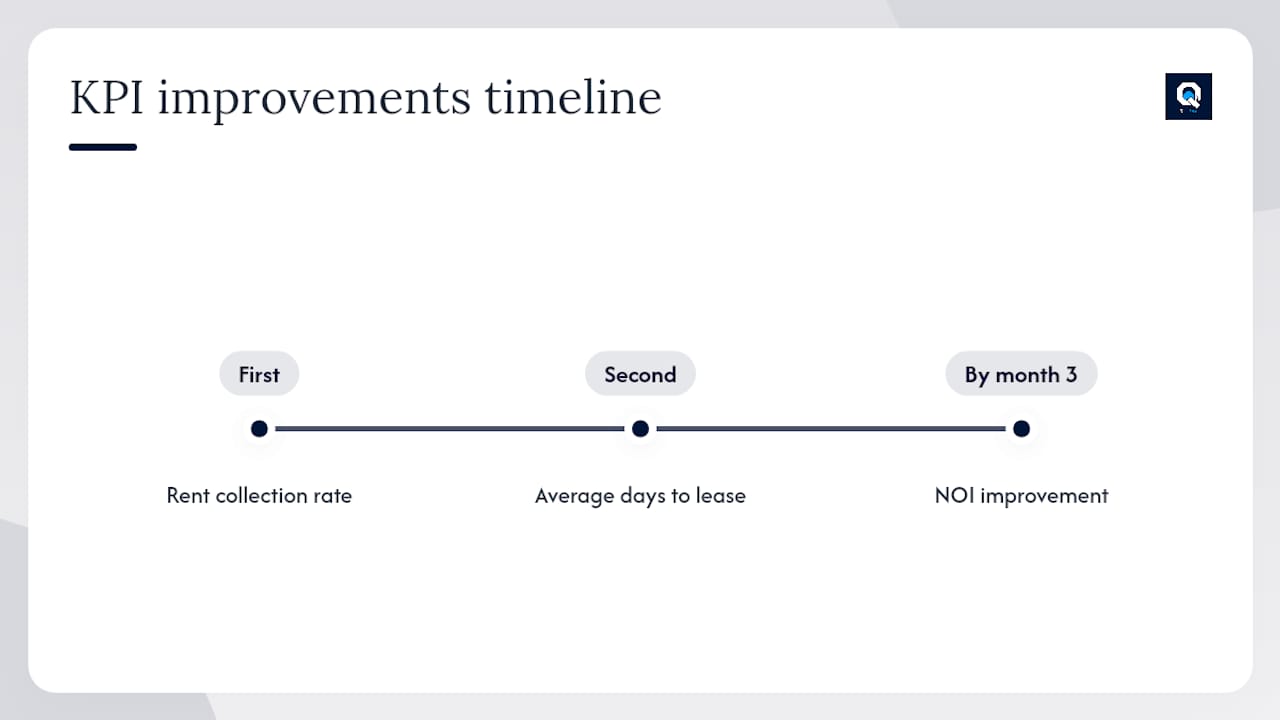
One pattern worth noting from portfolios that have gone through this process: the first KPI to improve after implementation is almost always rent collection rate, because automated reminders and online payment access remove the friction that causes most late payments. The second improvement typically shows up in average days to lease, because having occupancy data visible in real time prompts faster pricing decisions. NOI improvement follows both, usually visible by month three.
The managers who get the most from a KPI program are not the ones who build the most sophisticated dashboard. They are the ones who review the same 12 numbers every month, ask the same disciplined questions, and make small corrections before small problems become expensive ones.
QuonSapp gives you a turnkey KPI foundation from day one
Most property managers spend weeks assembling KPI data from disconnected spreadsheets, payment portals, and maintenance logs. QuonSapp eliminates that assembly work by centralizing every data source the 12 core KPIs depend on into a single platform.

The portfolio dashboard surfaces occupancy rates, labor costs, maintenance metrics, and dues collection across all your properties without any manual aggregation. Stripe-native online payments feed collection rate and on-time payment analytics in real time, with direct-to-manager settlement and no intermediary holding period. Lease tracking with renewal alerts keeps your renewal rate and days-to-lease data current automatically. The maintenance work-order pipeline, with staff assignment, status tracking, and photo documentation, gives you completion time and first-time fix rate without a separate system.
For HOA portfolios, violation tracking, fine management, and board voting are built in alongside the same KPI infrastructure. Multi-company organizations get consolidated network stats across all linked sub-orgs from a single parent dashboard.
Ready to stand up your KPI scorecard without building it from scratch? Start with QuonSapp and have your first portfolio dashboard running within the week.
Useful sources and further reading
These sources informed the benchmarks, formulas, and frameworks throughout this article. Each one is worth bookmarking for ongoing reference.
- NARPM Financial Performance Guide — Accounting-aligned KPI definitions and owner-reporting standards. Use this to align your NOI and OER calculations with professional property management conventions.
- U.S. Census Bureau Housing Vacancies and Homeownership (HVS) — National and regional vacancy benchmarks updated quarterly. Use it to contextualize your local occupancy targets against macro market conditions.
- Balanced Asset Solutions — Property Management KPIs Guide — Practical KPI scorecard guidance with cadence recommendations. Useful for structuring your first 10–12 KPI set.
- Leasey.AI — Rent Collection Metrics and Benchmarks — Detailed guidance on collection KPIs, tenant segmentation, and automation tactics for improving on-time payment rates.
- RentViewer — Real Estate Collections Dashboard Guide — Dashboard design and data-source guidance for collections monitoring. Use it when building your aged receivables visualization.
- Pulse RevOps — Industry KPIs for Property Management — Comprehensive KPI list covering the two-sided framework (tenant revenue protection and owner-value metrics).
- VPM Solutions — Stop Managing by Feel and Start Scaling — Practitioner perspective on using KPIs for team accountability, hiring, and scaling.
- QuonSapp blog — Digital Property Management Guide — Practical strategies for increasing operational efficiency, with implementation guidance that complements the 90-day plan above.